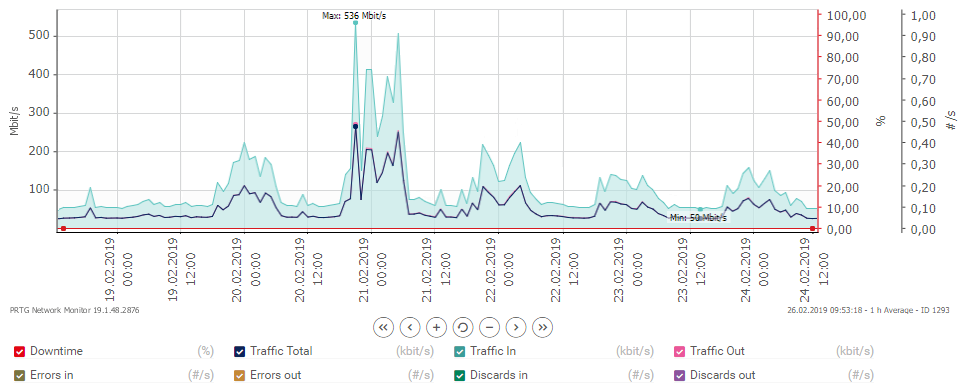
Reduced IT speed due to spikes in network traffic can significantly contribute to this problem. Most IT monitoring solutions make it easy for IT teams to identify sudden or particularly alarming spikes in network traffic by communicating this data through graphical interfaces. But sometimes, alerting the problem is not enough, and the real challenge is to solve the mystery of the sudden peak in traffic.
Of course, all networks are different. But Paessler has worked with customers for several years to identify the causes of bandwidth spikes, and with the help of customer feedback, we have managed to rank a top-five over the most common:
- Scheduled backups within the LAN - Many backup products can be timed to run at a specific time, and if they overlap, even the strongest connection can be overloaded.
- Remote Backup Tools - Many companies use cloud-based solutions for their backups. Uploading large backups can cause severe loads and slow down Internet connections significantly.
- Virus scanner or software updates that are distributed within the LAN.
- Mail Server Problems - An external mail server may try every five minutes to send a 15 MB mail to the company's mail server every five minutes, even if the target server is set to deny access. This too can cause an overload of infrastructure.
- Malware and attempted hacking.

This list lists some of the most common issues related to enterprise IT, but there are many other factors contributing to spike in bandwidth. Other causes may e.g. be large downloads among network users, video conferencing or hardware failure.
However, while the list can be used as a reference, it is important that corporate IT teams spend some time on basic network troubleshooting - it is the best and ultimately only method for the administrator to diagnose what is causing spikes. With an IT monitoring tool, companies are given a number of initial steps to dig into the root of the problem.
The first is to consider if there is a pattern in these spikes. Do they occur at roughly the same intervals? Do they show up during working hours (indicating that the peak is due to a user) or later (a sign that the reason lies in some time settings)? If one can identify a pattern, the next step is to try to find other monitoring points in the system that match. The key lies in comparing the pattern with other processes on the network. For example, a CPU peak load on one of the servers may. be in sync with the bandwidth load.
What you can also consider is analyzing the traffic with a packed sniffer or a flow monitoring tool. This can provide insight into what has triggered the network spike. Paessler's PRTG includes packet sniffing and flow monitoring to analyze network data. The best way to find out how PRTG can make your life easier is to download a trial. You can test PRTG for a month - with all features and at no cost. All information as well as the PRTG trial can be found here.


